1. Introduction: When Network Traffic Becomes a Security Incident
An organisation's website suddenly becomes unavailable. Users report connection timeouts, the firewall records a sharp increase in incoming traffic, and network monitoring shows an unexpected rise in traffic volume.
At first, the problem could have several explanations. A legitimate traffic surge, a misconfigured application, a network failure, or a DDoS attack may produce similar symptoms.
For a SOC analyst, the challenge is to determine what is happening without relying on a single alert or metric.
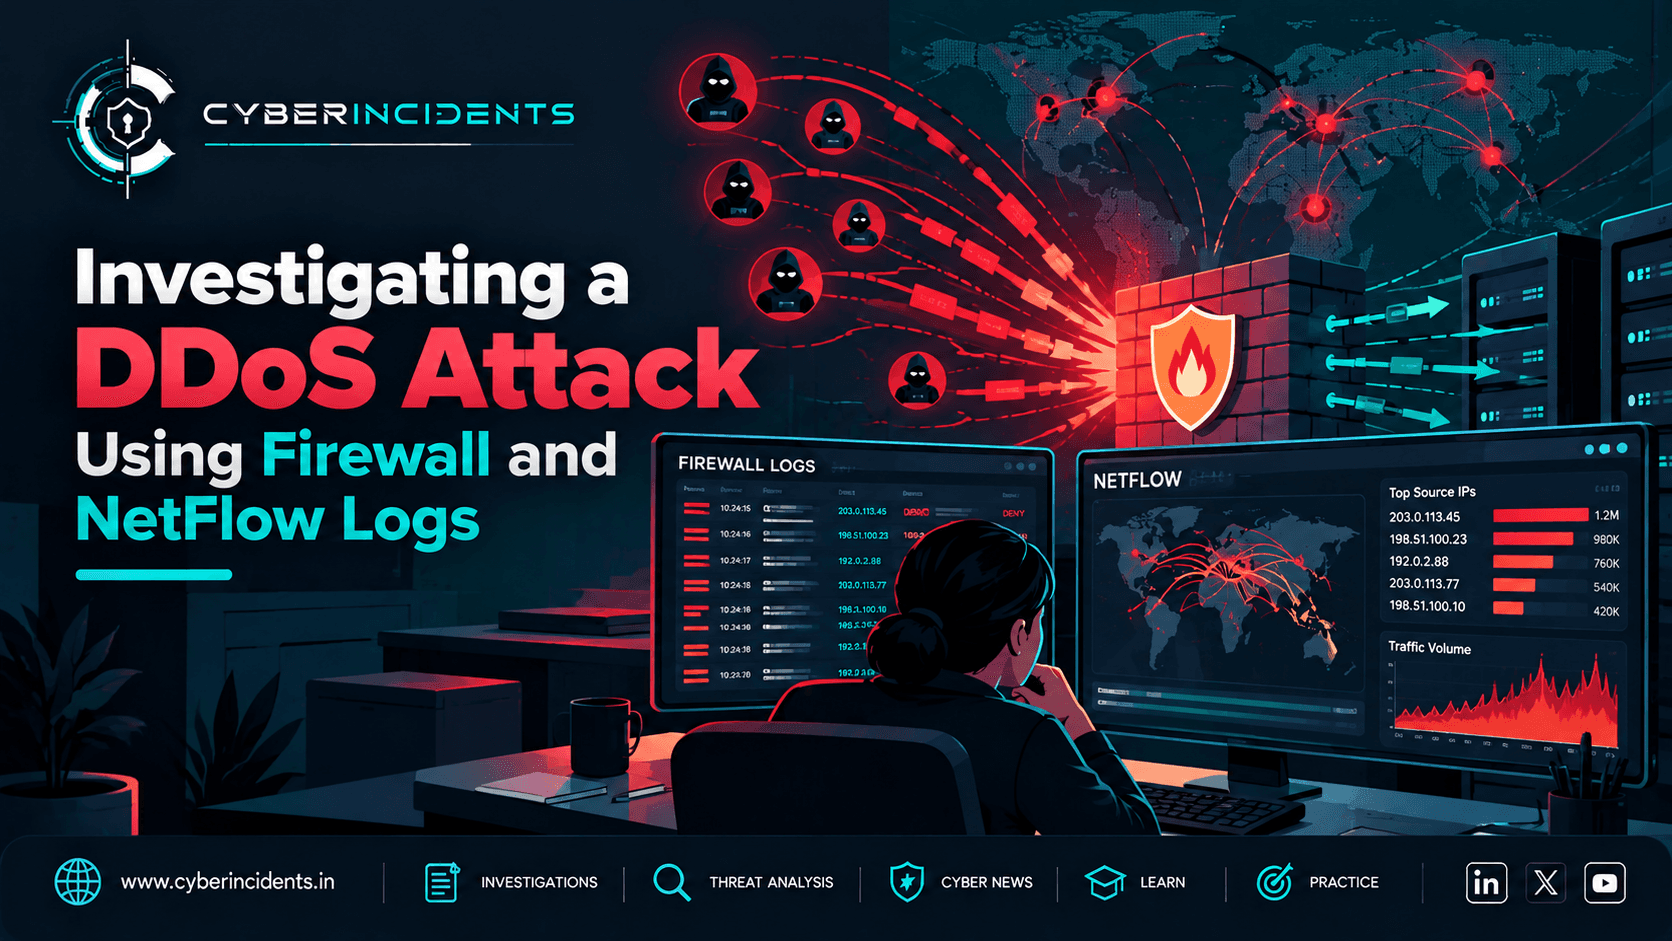
Two valuable sources of evidence are firewall logs and NetFlow records. Although they provide different perspectives, combining them can help investigators reconstruct the traffic pattern, identify affected services, establish when the incident began, and determine whether defensive controls are working.
Firewall logs show how a security device handled traffic. NetFlow provides metadata about network conversations, helping analysts understand which systems communicated, how much data moved, and how traffic changed over time.
Together, these sources support a more complete investigation of suspected DDoS activity.
2. Understanding Firewall Logs During a DDoS Attack
Firewalls enforce network policies by allowing, blocking, or otherwise handling traffic according to their configuration.
Depending on the product and logging settings, firewall records may include:
Source and destination IP addresses.
Source and destination ports.
Network protocol.
Traffic direction and interface.
Allow, deny, reset, or drop actions.
Session start and end timestamps.
Bytes and packets transmitted or received.
Connection duration and session state.
Policy or rule identifiers.
These fields help investigators understand how traffic reached the target and how the firewall processed it.
What firewall logs can reveal
Sudden increases in connection attempts: A sharp rise in attempts against one destination may indicate a traffic flood or another form of abnormal demand.
Repeated denied traffic: Large volumes of denied connections can indicate unwanted traffic, although scans, configuration errors, and legitimate failed connections can produce similar patterns.
Unusual protocol distribution: A change in TCP, UDP, or other protocol activity may help identify the type of traffic contributing to the incident.
Session-state pressure: Some firewalls record session counts, connection timeouts, or resource-exhaustion events that can indicate pressure on state-tracking resources.
Traffic reaching protected services: Allowed traffic can help establish whether the attack is reaching the server or being stopped at the network perimeter.
An important limitation is that firewall logs do not necessarily record every packet. Many devices log session summaries, selected events, or sampled traffic rather than every connection attempt. Investigators should understand the device's logging configuration before interpreting counts.
3. Understanding NetFlow Records
NetFlow is a network traffic-monitoring technology that summarises IP traffic into flow records. Related technologies, including IPFIX and sFlow, provide similar or complementary visibility but do not use identical collection methods or record formats.
A typical NetFlow record may include:
Source and destination IP addresses.
Source and destination ports.
Layer 4 protocol.
Number of packets and bytes.
Flow start and end times.
Ingress or egress interface.
TCP flags, when supported and exported.
A flow generally represents traffic sharing a defined set of attributes over a period of time. Exact flow definitions and available fields depend on the exporter and configuration.
Why NetFlow is useful during DDoS investigations
NetFlow helps analysts examine traffic patterns at scale without needing a full packet capture of every communication.
It can reveal:
Which destinations receive the most traffic.
Which protocols account for the largest traffic volumes.
Whether incoming or outgoing traffic has increased.
Which network interfaces carry the traffic.
Whether traffic is concentrated or distributed across many sources.
How packet rates, byte counts, and communication patterns change over time.
NetFlow is particularly useful for establishing a traffic baseline and identifying deviations from normal operations.
However, a flow record does not necessarily contain application payloads or a complete record of individual packets. It may not establish whether an HTTP request was malicious or whether a TCP handshake completed successfully.
4. Firewall Logs vs. NetFlow: What Each Source Tells You
Investigation questionFirewall logsNetFlow recordsWas traffic allowed or blocked?Usually availableGenerally not available by itselfWhich IP addresses communicated?Usually availableUsually availableHow much traffic moved?Depends on session loggingCommonly includes bytes and packetsWhich service was targeted?Destination IP and portDestination IP and portDid a security policy trigger?Often availableNot inherentlyWhat protocols carried the traffic?Available in typical recordsAvailable in typical recordsWas the application request malicious?Usually insufficient aloneUsually insufficient aloneDid the service become unavailable?Requires correlationRequires correlation
The two sources complement one another. Firewall records help explain policy decisions, while NetFlow helps establish the broader shape and distribution of traffic.
Neither source independently proves that a DDoS attack occurred.
5. Step One: Establish the Incident Timeline
The first task is to determine when the suspected attack began and how it relates to the reported service disruption.
Collect:
The time the outage or degradation was first observed.
The affected service, IP address, and port.
Firewall alerts and traffic summaries.
NetFlow records for the relevant network interfaces.
Application availability and latency metrics.
Any known maintenance, releases, or legitimate traffic events.
Normalise timestamps and account for time zones, clock drift, and differences in log ingestion time.
Build a timeline showing changes in traffic volume, connection activity, firewall actions, and service health.
For example, if incoming traffic rises sharply at 14:05 and application timeouts begin at 14:07, the events may be related. However, the timing alone does not establish causation. Investigators must determine whether the traffic reached the affected service and whether the service's resources were actually constrained.
6. Step Two: Identify Traffic Anomalies in NetFlow
Begin by comparing current traffic with a baseline for the same destination, interface, protocol, and time period.
Useful measurements include:
Bits per second (bps).
Packets per second (pps).
Flow count per interval.
Traffic volume by destination IP and port.
Traffic volume by protocol.
Number of distinct source addresses.
Incoming versus outgoing traffic.
A DDoS attack may produce a sudden increase in one or more of these metrics.
Example investigation
Suppose a public web server normally receives a relatively stable volume of incoming traffic. During the incident, NetFlow shows:
A substantial increase in inbound packets.
A concentration of traffic on the server's public IP.
An unusual increase in traffic directed at TCP port 443.
A corresponding increase in failed connection attempts reported by the service.
These findings support further investigation, but they do not independently confirm a SYN flood or an HTTP flood.
To determine the attack type, the analyst needs additional evidence about TCP flags, handshake completion, HTTP request behaviour, and server resource utilisation.
Useful questions
Is the increase in bytes, packets, or both?
Is one destination receiving most of the traffic?
Is the traffic concentrated on one port or spread across several services?
Is the traffic arriving from a small number of sources or a broad distribution?
Is the traffic being dropped upstream, at the firewall, or by the destination?
Does the increase coincide with service degradation?
The answers help narrow the investigation and determine where more detailed telemetry is required.
7. Step Three: Analyse Firewall Decisions and Connection Behaviour
Once the traffic anomaly is identified, examine how the firewall handles the relevant traffic.
Filter the records by the affected destination, port, protocol, and time window.
Look for:
A sudden increase in allow or deny events.
Unusual session creation or teardown rates.
Repeated connection attempts.
Changes in reset or timeout activity.
Firewall resource warnings.
Policy actions affecting the target service.
Evidence that traffic is reaching the server despite filtering.
Interpreting allow and deny events
A high number of denied connections does not automatically mean the attack is being successfully mitigated. The volume may still consume firewall processing resources or saturate the upstream connection.
Similarly, allowed traffic does not automatically indicate a firewall failure. Legitimate requests must continue to reach protected services, and some DDoS traffic may resemble valid connections.
Analysts should also determine whether the firewall logs individual packets, individual sessions, or only selected events. Comparing raw log counts with NetFlow flow counts without accounting for those differences can produce misleading conclusions.
8. Step Four: Distinguish Between DDoS Attack Types
Firewall and NetFlow data can help identify likely attack categories, but additional telemetry may be required for confirmation.
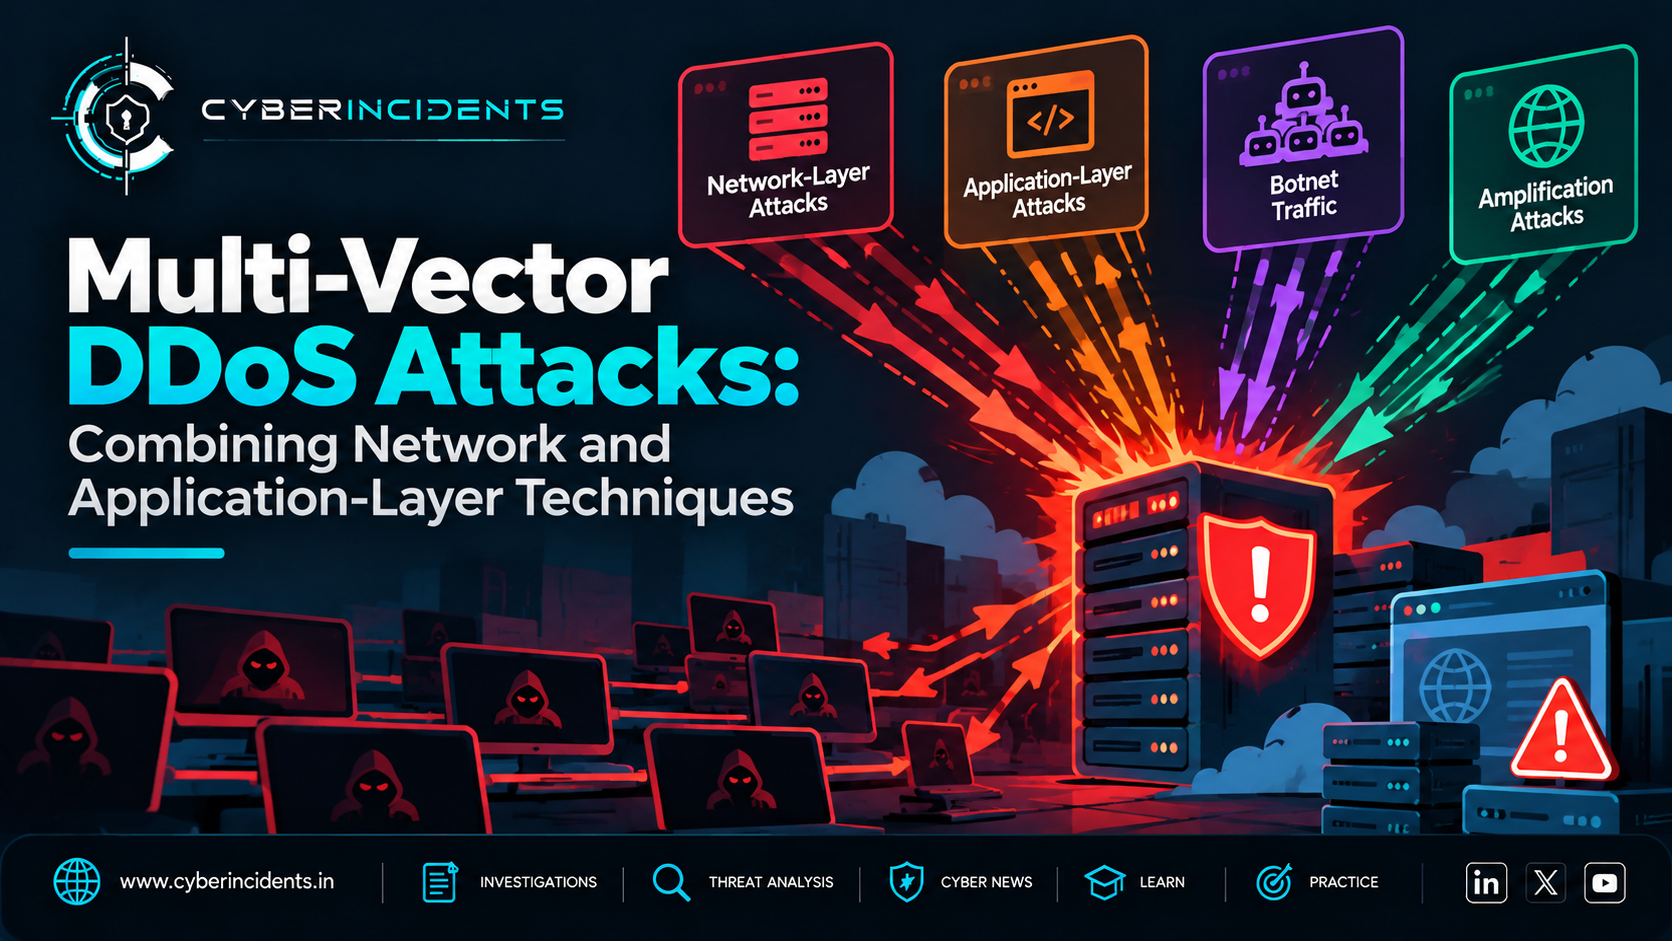
Possible attackPotential network evidenceAdditional evidence to seekVolumetric floodVery high inbound bandwidth or packet rateInterface utilisation and upstream provider telemetryTCP SYN floodElevated SYN-related traffic and incomplete connectionsTCP flags, handshake metrics, pending-connection queuesUDP floodIncreased UDP packet rates or traffic volumesDestination ports, packet characteristics, service logsHTTP floodIncreased traffic to web servicesHTTP access logs, request rates, endpoint latencyMulti-vector DDoSSeveral abnormal traffic patterns occurring togetherCorrelated network, firewall, application, and infrastructure metrics
A high volume of TCP traffic to port 443 does not establish that an HTTP flood is occurring. HTTPS traffic may be encrypted, and the same port can carry legitimate requests or other TCP-based activity.
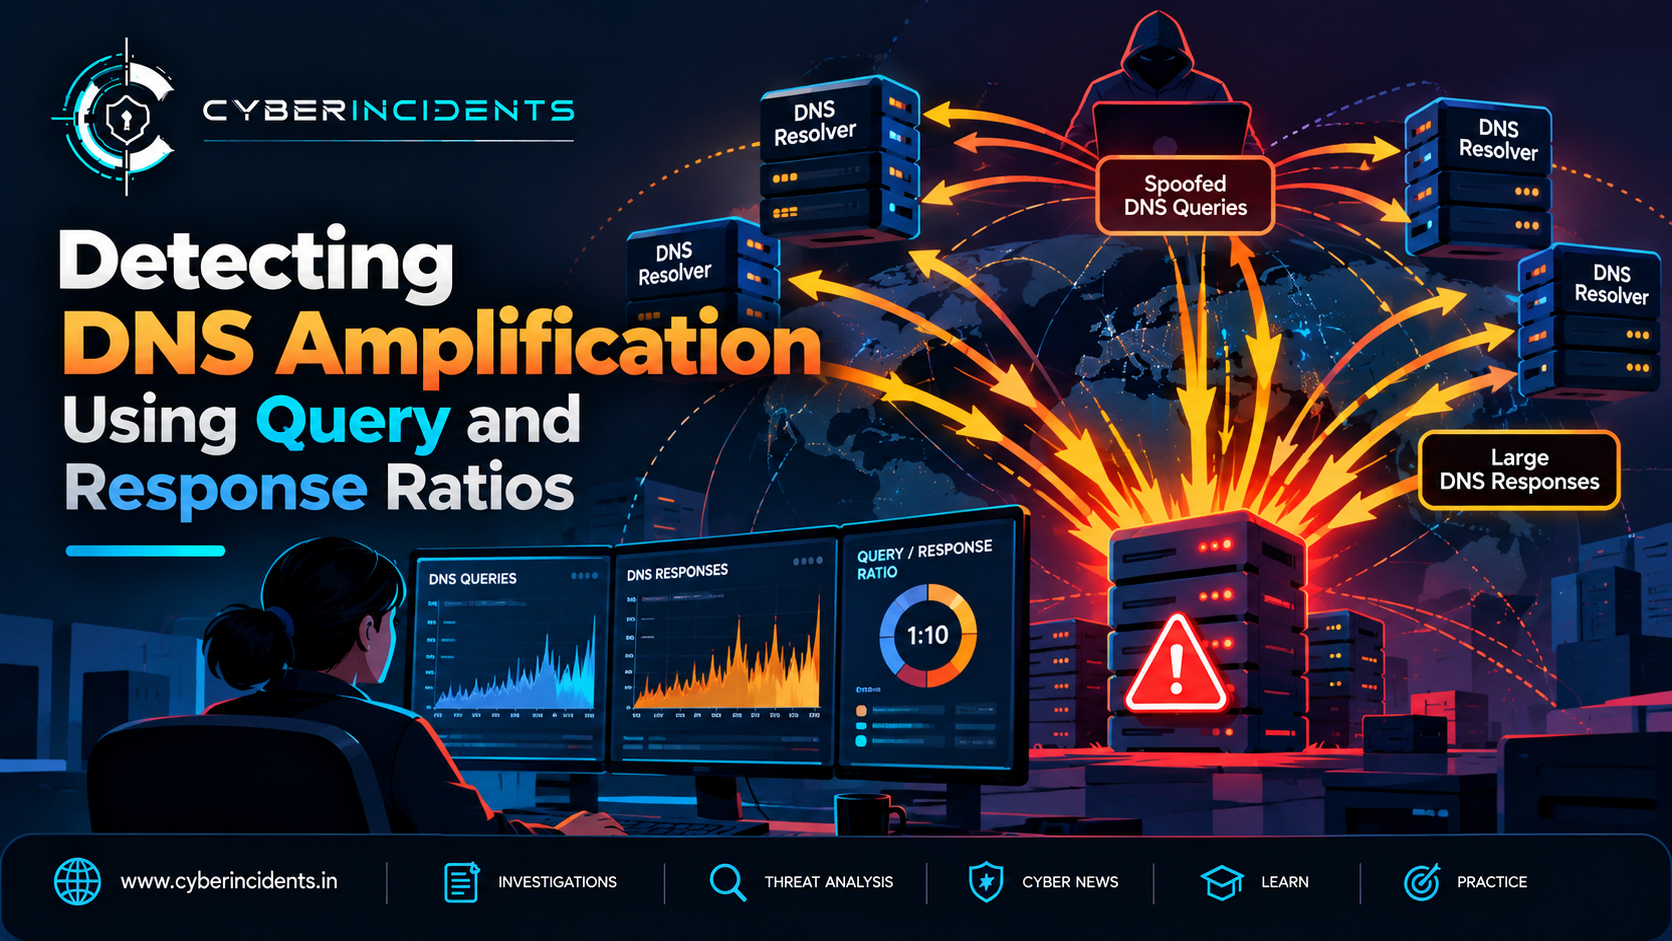
Likewise, UDP traffic alone does not establish reflection or amplification. Investigators need evidence about packet characteristics, protocol behaviour, and the surrounding traffic pattern.
9. Step Five: Investigate Source Distribution
Source-address analysis can help describe the traffic pattern and support filtering decisions.
Investigators may examine:
The number of unique source IP addresses.
The volume of traffic associated with each source.
Source networks and autonomous systems.
Geographic distribution, with appropriate caution.
Repeated traffic patterns across source groups.
Whether source addresses change significantly over time.
A concentrated traffic pattern may suggest a small set of dominant sources. A broad distribution may be consistent with a distributed attack.
However, source distribution is not a reliable standalone attribution method.
Attack traffic can involve spoofed addresses, compromised systems, proxies, or cloud infrastructure. Geolocation databases can also be inaccurate, and legitimate services may aggregate traffic from many users behind shared addresses.
Use source analysis to understand and mitigate the traffic, not to claim attacker identity without corroborating evidence.
10. Practical Analysis Using a SIEM
Centralising firewall and flow records in a SIEM allows analysts to correlate traffic anomalies with security alerts and service-health events.
A useful dashboard may include:
Incoming bytes and packets over time.
Top destination IP addresses and ports.
Protocol distribution.
Allowed versus denied traffic.
Unique source counts.
Session creation and failure rates.
Application latency and error rates.
Firewall and network-device health.
Example Splunk query
The following is an illustrative starting point for firewall logs that use the field names dest_ip, dest_port, action, and bytes. Adjust the index, sourcetype, and field names to match the actual data source.
index=firewall earliest=-60m
| stats count AS log_events
sum(bytes) AS total_bytes
dc(src_ip) AS unique_sources
by dest_ip dest_port action
| sort - total_bytes
This query summarises logged events by destination and firewall action. It is not a direct measurement of packets per second or a definitive DDoS detector. Its accuracy depends on what each log event represents and whether the bytes field is populated consistently.
For time-based analysis, group records into suitable time intervals and compare them with historical baselines. Use NetFlow-specific data to calculate flow-level packet and byte trends where those fields are available.
Example SIEM detection logic
A practical detection can look for several conditions together:
Traffic volume or packet rate exceeds a service-specific baseline.
The increase is concentrated on a protected destination or service.
Firewall or connection telemetry shows unusual connection behaviour.
Availability or latency metrics indicate service degradation.
Thresholds should be tuned to the organisation's normal traffic patterns. Fixed thresholds can generate false positives during legitimate events, while thresholds that are too high can delay detection.
11. Mitigation and Response
Once the investigation supports a DDoS diagnosis, mitigation should be applied at the point where it can reduce the impact most effectively.
Network-layer mitigation
Use appropriate firewall controls, rate limiting, upstream filtering, or traffic-scrubbing services to address the observed traffic pattern.
If the internet connection is saturated, local firewall rules may not be enough because the traffic has already consumed the available link capacity.
Connection-state protection
For attacks targeting TCP connection establishment, consider suitable SYN-cookie support, backlog configuration, and connection-handling controls.
Validate that these measures address the actual bottleneck rather than merely shifting resource pressure to another component.
Application-layer mitigation
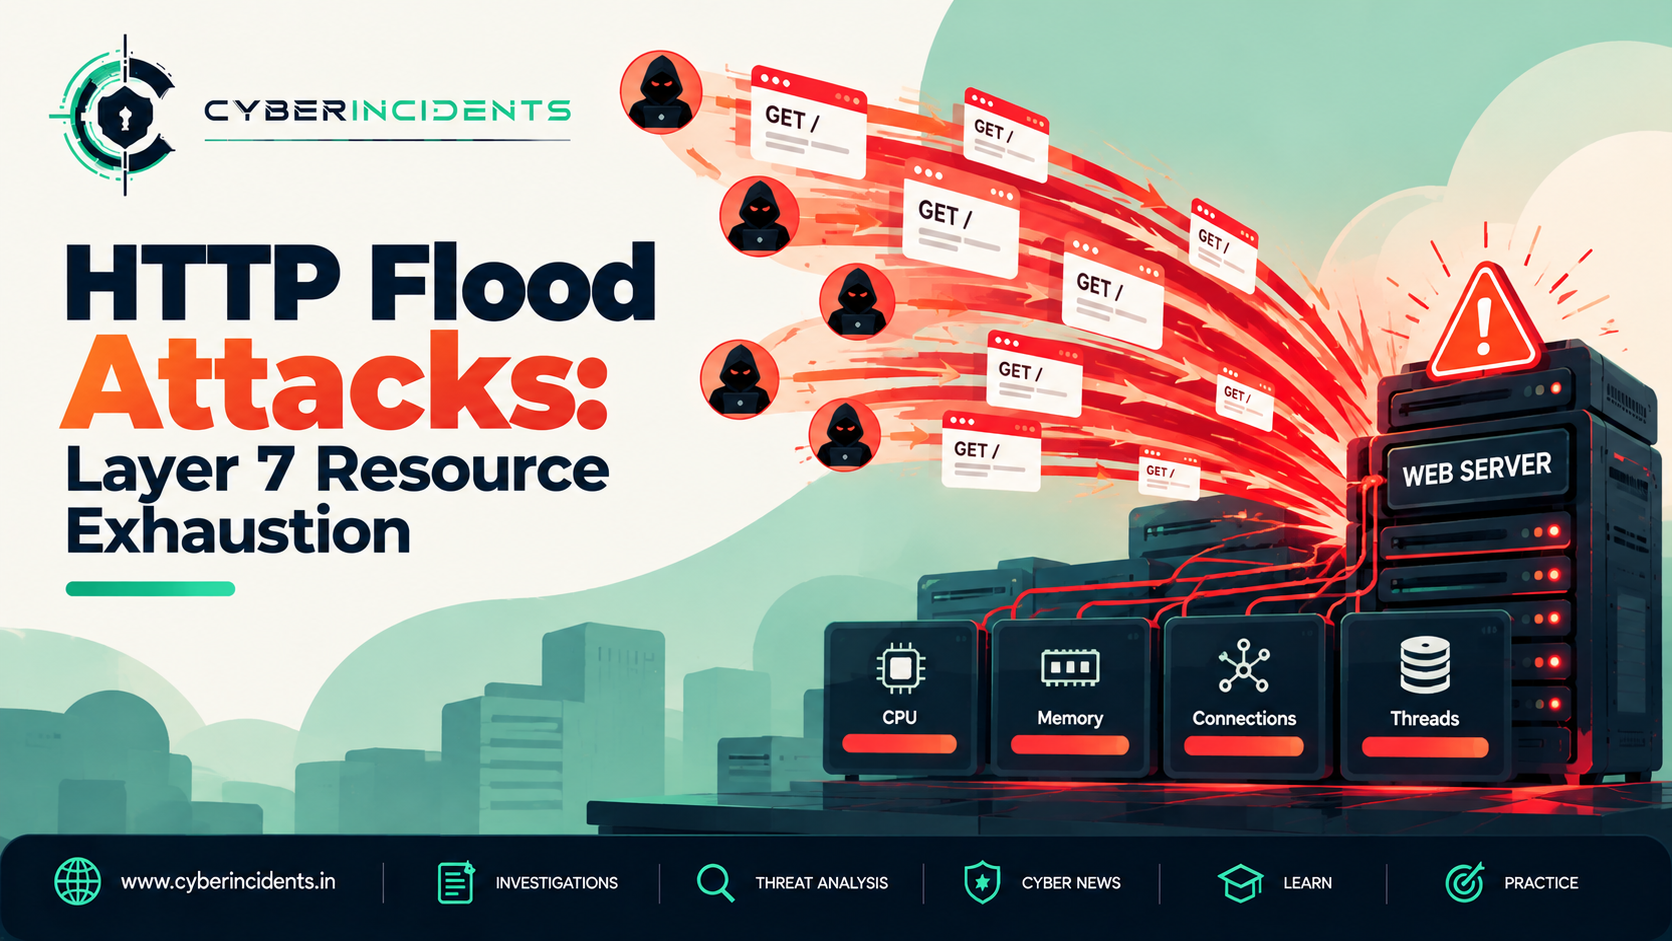
For HTTP and API floods, use CDN protection, reverse proxies, WAF rules, caching, and application-specific rate limits where appropriate.
These controls should be based on observed request behaviour and should avoid unnecessarily blocking legitimate users.
Coordinate with upstream providers
Contact the ISP, hosting provider, or DDoS mitigation service when traffic exceeds local capacity.
Provide the affected destinations, time window, traffic characteristics, and supporting telemetry. Provider-side visibility can help establish whether the attack is saturating the network before traffic reaches the organisation.
Verify recovery
After mitigation, confirm that traffic has returned to an acceptable level, connection handling has stabilised, and legitimate users can access the service.
Continue monitoring for changes in attack patterns and document any operational side effects caused by the mitigation.
12. Common Investigation Mistakes
Treating every traffic spike as malicious. Legitimate demand, scheduled jobs, software releases, and network faults can produce similar patterns.
Relying on source IP counts alone. Distributed traffic does not automatically establish a DDoS attack, and source addresses may be spoofed or shared.
Confusing flow records with packet captures. NetFlow provides summarised traffic metadata, not necessarily the full contents or exact sequence of packets.
Ignoring logging gaps. Sampling, incomplete exports, device overload, and retention limits can affect the available evidence.
Blocking traffic without understanding the bottleneck. A local rule may not help when the upstream link is already saturated.
Failing to correlate service impact. High traffic volume alone does not prove that the traffic caused an outage.
Assuming that blocked traffic has no operational cost. Processing and logging large numbers of denied packets can still place pressure on security infrastructure.
13. MITRE ATT&CK Mapping
The following techniques may be relevant when supported by the investigation findings.
TechniqueIDRelevanceNetwork Denial of ServiceT1498Network traffic overwhelms availability or network capacityDirect Network FloodT1498.001Traffic directly floods the targetEndpoint Denial of ServiceT1499Endpoint resources are exhaustedApplication Exhaustion FloodT1499.003Application requests exhaust service resources
Do not assign every technique automatically. A network-layer flood that saturates an upstream link differs from an application-layer attack that exhausts server resources. The mapping should describe the observed behaviour and actual impact.
Conclusion
Firewall logs and NetFlow records provide complementary evidence for investigating suspected DDoS attacks. Firewall logs help explain how traffic was handled, while NetFlow reveals broader communication patterns, traffic volumes, and protocol distribution.
When correlated with application logs, infrastructure metrics, and service-availability checks, these sources help SOC analysts establish the incident timeline, identify likely attack vectors, locate the affected resource, and support appropriate mitigation.
The most effective investigation is evidence-driven. Analysts should distinguish unusual traffic from confirmed attack activity, validate the service impact, and apply controls at the layer where the bottleneck occurs.
The key lesson: Firewall logs explain how traffic was handled; NetFlow helps reveal the wider traffic pattern. Together, they turn a suspected DDoS event into a structured, evidence-backed investigation.