1. Introduction: When Malicious Code Leaves No Obvious File
Traditional malware investigations often begin with a suspicious executable, a newly created file, or a malicious DLL detected by antivirus software. However, not every attack leaves a straightforward file-based artefact.
Some threats execute code directly in process memory, making conventional file-scanning approaches less effective. An endpoint may show a legitimate Windows process performing unusual operations even when investigators cannot locate a corresponding malicious DLL on disk.
One technique associated with this behaviour is reflective DLL injection.
Attackers may use it to execute malicious functionality within another process, potentially blending their activity with legitimate applications. Depending on the implementation, the technique can support defence evasion, execution, and other stages of an intrusion.
For defenders, the challenge is not simply to identify a suspicious file. It is to determine whether a process is executing code in an unexpected way, understand how that code entered memory, and establish what happened before and after execution.
2. Understanding Reflective DLL Injection
A Dynamic Link Library is a Windows file containing code or resources that applications can load and use. Under normal circumstances, Windows loads a DLL through established operating-system mechanisms that handle tasks such as mapping the image into memory and resolving its dependencies.
Reflective DLL loading takes a different approach. The DLL contains code capable of arranging its own loading into memory rather than relying entirely on the conventional Windows loader.
Reflective DLL injection extends this concept to execution within a target process. Depending on the implementation, an attacker may place DLL contents in memory, arrange for the reflective-loading routine to execute, and run the resulting code within the target process.
The exact implementation varies, but the technique generally involves several underlying operations:
Preparing DLL contents for use in memory.
Allocating memory in the relevant process.
Mapping or copying the required image components.
Resolving dependencies and performing necessary relocations.
Transferring execution to the appropriate code.
Executing the DLL's functionality within the process context.
Not every reflective loader performs these steps in exactly the same way. Some implementations also differ in whether they execute within the current process or involve a separate target process.
Reflective loading versus conventional DLL loading
Conventional DLL loading generally uses operating-system loader functionality, such as LoadLibrary, which performs the required loading work.
Reflective loading uses code within the DLL or a related loader routine to perform much of that work independently.
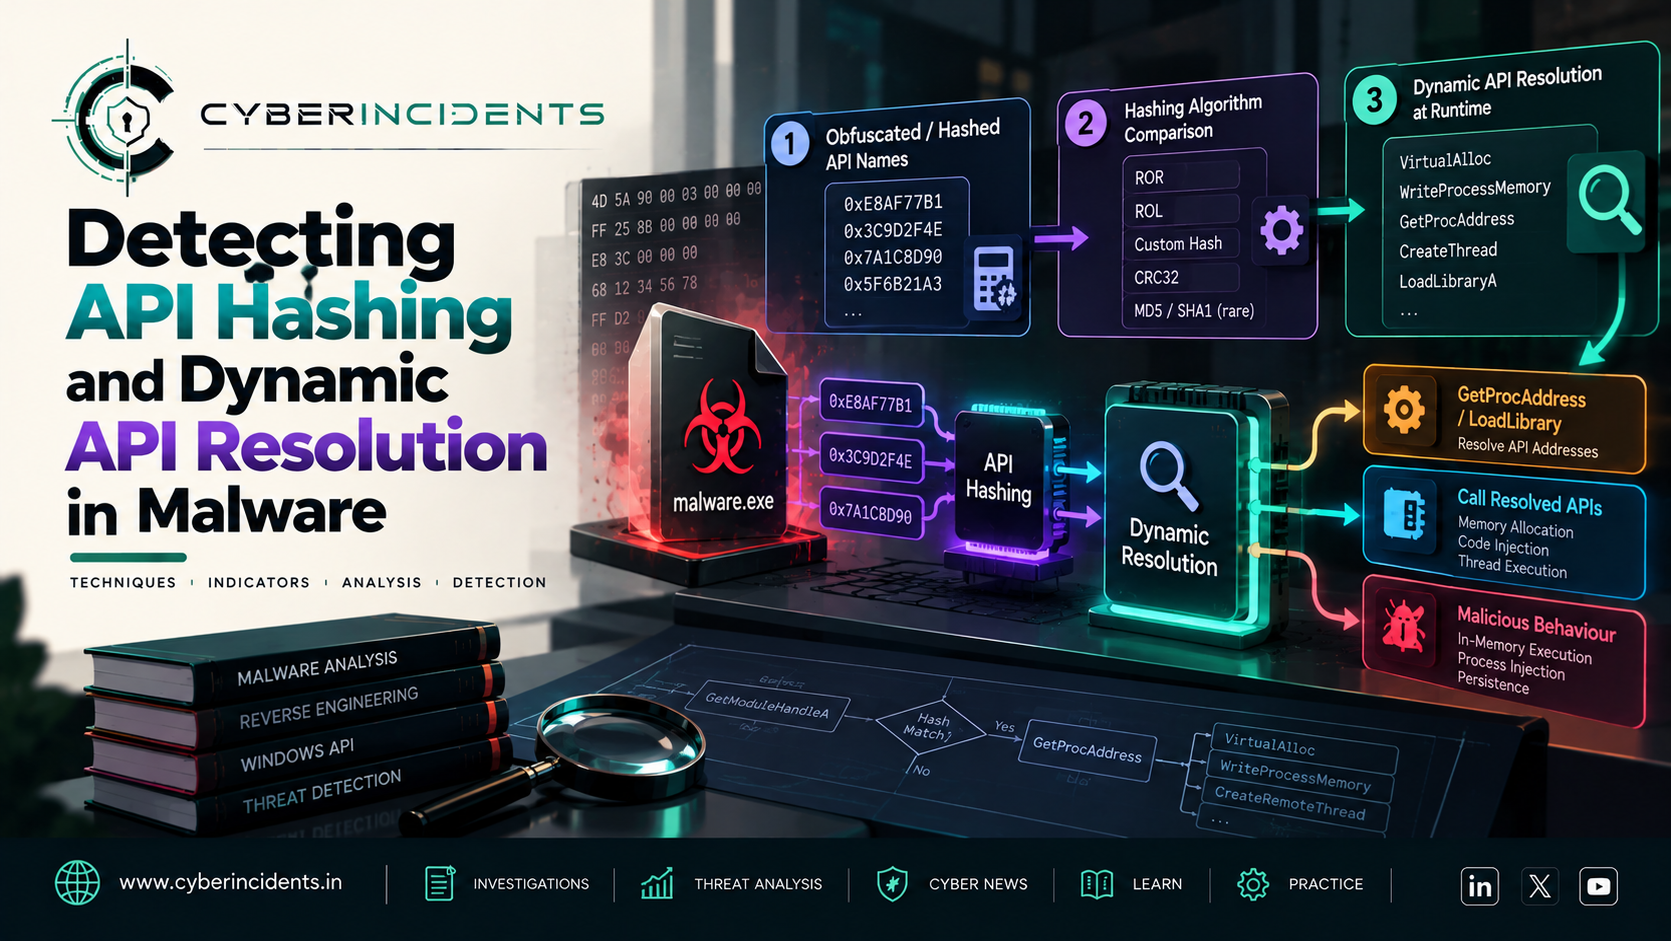
This distinction matters during investigations because memory-resident DLLs may not appear in the same way as conventionally loaded modules. For example, a DLL loaded reflectively may not have the usual module-list representation that analysts expect when examining a process.
However, the absence of a conventional module entry does not automatically establish malicious activity. Legitimate software may also use specialised loading mechanisms, and findings must be interpreted alongside other evidence.
3. What Is In-Memory Payload Execution?
In-memory payload execution refers to running code from memory rather than relying exclusively on a conventional executable or DLL file stored on disk.
A payload is the code or functionality delivered to perform an operation. Depending on the incident, this could involve credential access, command execution, reconnaissance, communications with external infrastructure, or additional stages of malware activity.
In-memory execution is a broad concept. It can involve shellcode, manually mapped modules, reflective DLL loading, script execution, or other techniques. These approaches are related, but they are not interchangeable.
Why attackers use in-memory execution
Reduced reliance on disk artefacts: Some implementations can execute without creating a conventional DLL file on disk.
Evasion of file-based detection: A scanner focused on files may have fewer opportunities to inspect the payload before execution.
Use of trusted processes: Code executing within a legitimate process may inherit its process identity and may make activity harder to distinguish from normal application behaviour.
Flexible payload delivery: A malicious component may be delivered or reconstructed in memory as part of a multi-stage intrusion.
These benefits are not guarantees of stealth. Endpoint detection and response platforms can inspect process behaviour, memory characteristics, API activity, and other telemetry. In-memory execution can also leave forensic artefacts even when no payload file remains.
4. Reflective DLL Injection Attack Flow
The following is a high-level investigative model of how reflective DLL injection may occur during an intrusion.
<escape>Initial Access → Payload Delivery → Memory Preparation → Reflective Loading → Code Execution → Follow-on Activity</escape>
Stage 1: Initial access
An attacker gains access through a compromised account, malicious attachment, exploited vulnerability, or another entry point.
At this stage, investigators should identify the earliest confirmed suspicious event rather than assume that the process exhibiting injection behaviour represents the initial compromise.
Stage 2: Payload delivery
A loader or other component obtains the payload. The delivery mechanism may involve a file, a script, a network response, or data already present in memory.
Relevant evidence can include process command lines, network connections, file creation events, script logs, and security-product detections.
Stage 3: Memory preparation
The loader prepares memory for the payload. Depending on the implementation, this may involve allocating memory, copying image data, or modifying memory protections.
Suspicious memory operations become more meaningful when associated with an unexpected process relationship or subsequent execution.
Stage 4: Reflective loading
The reflective loader arranges the DLL's in-memory representation and prepares it for execution.
Unlike a conventional DLL load, the resulting image may not be represented by the normal loader-maintained module structures. Memory analysis can therefore be important when investigating a suspected reflective-loading event.
Stage 5: Code execution
Execution transfers to code associated with the loaded payload. Depending on the attack, this may occur in the original process or another process.
Investigators should correlate memory changes with thread activity, process access, execution timing, and the process's normal responsibilities.
Stage 6: Follow-on activity
The payload may perform reconnaissance, communicate with external systems, access sensitive data, or attempt additional execution and persistence.
The presence of suspicious in-memory code does not, by itself, prove which follow-on actions occurred. Analysts must confirm those activities through separate evidence.
5. Why Reflective DLL Injection Can Evade Traditional Detection
Traditional security controls often inspect files, known signatures, and established loading behaviour. Reflective loading can reduce the usefulness of some of these approaches, particularly when a payload is never written to disk as a conventional DLL.
Several factors complicate detection.
Fileless or low-file activity
The absence of a dropped DLL may reduce the available file artefacts. Nevertheless, the initial loader or delivery mechanism may still create files, and execution may generate other observable events.
Unusual memory regions
Investigators may find executable memory that does not correspond to a normally loaded image, or memory regions with permissions that differ from typical application behaviour.
Such regions are not inherently malicious. JIT compilers, browsers, security software, and other legitimate applications can also create executable memory.
Unexpected thread behaviour
A thread executing code from an unusual memory region can provide an important investigative lead, particularly when combined with suspicious memory allocation or cross-process activity.
Incomplete module visibility
A reflectively loaded image may not appear in conventional module enumeration. This can create discrepancies between module lists, virtual memory maps, and the code that appears to be executing.
Abuse of legitimate processes
A payload executing inside a trusted process can complicate attribution if investigators rely only on the process name. The process's parent, command line, loaded modules, memory state, and behaviour all need to be examined.
Defensive takeaway: No single memory characteristic proves reflective DLL injection. Strong detection comes from correlating multiple signals and establishing whether the behaviour is expected for that application.
6. SOC Investigation: Identifying Suspected Reflective DLL Injection
When an EDR alert or memory-analysis finding suggests reflective DLL injection, analysts should follow a structured process.
Step 1: Validate the alert
Collect the alert details, including:
Hostname and affected user.
Process name, process ID, and parent process.
Process creation time and command line.
Detection reason and any associated memory-operation telemetry.
Related files, network connections, and security alerts.
Determine whether the detection identifies confirmed injection, suspicious memory behaviour, or only a heuristic indicator.
Step 2: Establish process legitimacy
Investigate the target process before drawing conclusions.
Review its executable path, digital signature, hash, parent-child relationships, command line, account context, and expected role on the endpoint.
A legitimate process name is not proof of legitimacy. Malware can abuse genuine system binaries, while legitimate software can exhibit unusual memory behaviour.
Step 3: Examine memory-related telemetry
Where supported by the EDR platform, investigate:
Memory allocation and protection changes.
Cross-process access and memory-writing activity.
Thread creation and unusual execution locations.
Executable memory not associated with expected modules.
Discrepancies between module enumeration and memory mappings.
Interpret these observations together. For example, executable private memory becomes more concerning when an unexpected process writes into it and execution subsequently transfers to that region.
Step 4: Review process and network activity
Build a timeline around the suspected event.
Look for suspicious script interpreters, unexpected child processes, unusual outbound connections, access to sensitive files, credential-access indicators, and subsequent attempts to execute additional code.
Correlate endpoint evidence with DNS, proxy, firewall, identity, and authentication logs where available.
Step 5: Determine scope and impact
Search across the environment for related process behaviours, file hashes, command lines, network destinations, and other indicators supported by the evidence.
Assess whether the activity affected one endpoint or multiple systems. Determine whether sensitive data was accessed, credentials may have been exposed, or persistence was established.
Step 6: Contain and preserve evidence
If malicious execution is sufficiently supported by the evidence, follow the organisation's incident-response procedures. Actions may include isolating the endpoint, restricting affected accounts, blocking confirmed malicious infrastructure, and collecting relevant forensic evidence.
When feasible, acquire volatile memory before powering down or restarting the system, as these actions can destroy important evidence. Follow established forensic procedures and document collection times and handling.
Step 7: Document the conclusion
Classify the event as confirmed malicious, likely malicious, suspicious but unconfirmed, or benign based on the available evidence.
Record the observed behaviour, supporting artefacts, affected processes, timeline, scope, containment actions, and remaining uncertainties.
7. Evidence and Indicators to Examine
The following table describes investigative leads, not definitive proof of reflective DLL injection.
Evidence sourceWhat to examineInvestigative valueEDR process telemetryParent-child relationships, command lines, process accessEstablishes execution contextVirtual memory analysisPrivate executable memory, memory protections, image mappingsIdentifies unusual in-memory codeThread analysisThread start addresses and execution locationsHelps identify unexpected code executionModule enumerationDifferences between module lists and mapped memoryMay reveal manually mapped imagesWindows event and security logsProcess creation and relevant security eventsSupports timeline reconstructionNetwork telemetryDNS queries, connections, destinations, data transferHelps identify payload delivery or follow-on communicationsFile-system telemetryTemporary files, DLLs, scripts, deleted artefactsMay reveal supporting payload or loader activity
Important forensic limitation
Windows does not provide one universal event ID that confirms reflective DLL injection. Visibility depends on the operating-system configuration, EDR product, auditing settings, and whether memory or specialised telemetry was collected.
For that reason, investigators should avoid treating a missing event as proof that injection did not occur.
8. MITRE ATT&CK Mapping
Reflective DLL injection and related in-memory execution behaviours may map to the following MITRE ATT&CK techniques, depending on the evidence:
TechniqueIDRelevanceProcess InjectionT1055Relevant when code is executed within another process through an injection techniqueReflective Code LoadingT1620Relevant when code is reflectively loaded into memoryVirtualization/Sandbox EvasionT1497Relevant only if separate evidence shows behaviour intended to detect or evade analysis environmentsObfuscated Files or InformationT1027Relevant only when the payload or its representation is obfuscated
ATT&CK mapping should describe observed behaviour, not merely a suspected capability. For example, reflective loading within a process does not automatically establish sandbox evasion or obfuscation.
9. Prevention and Detection Strategies
Organisations should combine endpoint controls, behavioural detection, memory visibility, and incident-response readiness.
Use behavioural EDR detections
Prioritise detections that correlate suspicious memory allocation, memory writing, protection changes, cross-process access, and execution behaviour.
Avoid relying exclusively on process names, static signatures, or the assumption that all malicious DLLs appear as files.
Monitor suspicious process relationships
Investigate unexpected relationships between scripting tools, document applications, browsers, system utilities, and processes that access sensitive resources.
Baseline normal application behaviour to reduce false positives.
Enable appropriate endpoint telemetry
Ensure that endpoint products collect the process and memory-related information required for investigations. Understand which events are available, how long they are retained, and whether additional forensic collection is necessary.
Harden endpoints
Keep operating systems and applications updated, restrict unnecessary administrative privileges, apply application-control policies where practical, and limit untrusted code execution.
Strengthen identity security
Use phishing-resistant authentication for sensitive accounts, monitor suspicious sign-ins, and restrict privileged access. These controls help reduce the risk of an attacker reaching the stage where in-memory payload execution becomes possible.
Prepare for memory forensics
Maintain documented procedures for acquiring volatile memory, preserving evidence, analysing suspicious regions, and escalating cases that cannot be resolved using ordinary endpoint telemetry.
10. Common Analyst Mistakes
Assuming every executable memory region is malicious. Modern applications legitimately generate and execute code dynamically.
Trusting a process because its name is legitimate. A genuine process can be abused, and a malicious binary can imitate a familiar name.
Treating missing DLL files as proof of fileless execution. Files may have been deleted, missed by telemetry, or never collected.
Relying on a single EDR alert. Heuristic detections require validation through supporting evidence.
Ignoring activity after the injection. Understanding what the payload did is essential for determining impact and scope.
Restarting a system before considering volatile evidence. A restart can destroy memory-resident artefacts that may be critical to the investigation.
Conclusion
Reflective DLL injection demonstrates why modern malware investigations must extend beyond files and signatures. By loading code into memory through a non-standard loading process, attackers can complicate conventional module inspection and reduce their reliance on persistent payload files.
For SOC analysts, the most effective approach combines process lineage, memory analysis, thread behaviour, endpoint detections, and network telemetry. No individual indicator is sufficient in every case; the objective is to establish a coherent, evidence-backed explanation of how the code entered memory, where it executed, and what it did next.
As threats increasingly combine file-based and memory-resident execution, organisations need detection engineering and forensic processes that can identify suspicious behaviour even when a conventional malicious file is absent.
The key lesson: Investigate what a process is doing in memory, not only which files exist on disk.